Meta Ads Benchmarks for Ecommerce: How to Compare Results
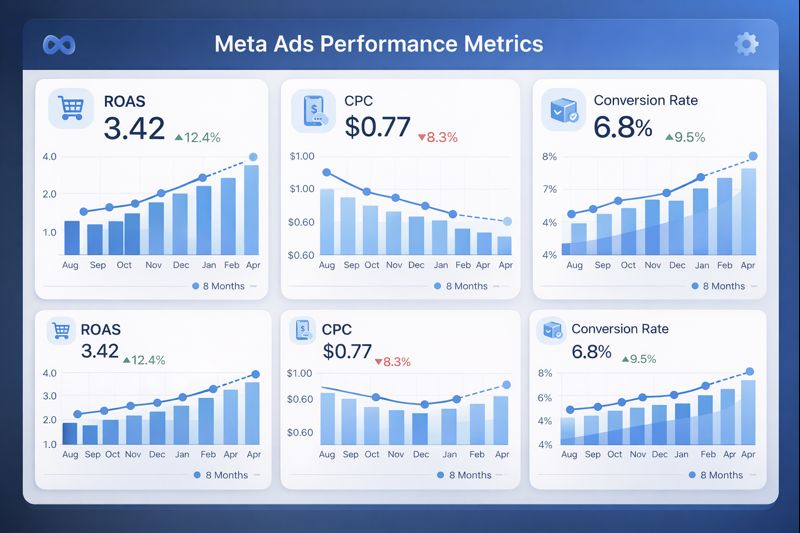
A Meta Ads benchmark is useful only when the metric definition, business model, market, period, objective, attribution, and comparison cohort are close enough to support a decision. A global average can provide context, but it cannot tell an ecommerce business whether its acquisition is affordable or what should change next.
This page previously published precise “healthy” ranges and a portfolio-spend claim without a source dataset or methodology in the repository. Those figures have been removed. The framework below shows how to build and interpret a defensible benchmark from the business's own data and any external source that discloses its methods.
Benchmark Source Quality Checklist
| Source field | Question to answer | Why it matters |
|---|---|---|
| Population | How many accounts, campaigns, impressions, clicks, or purchases are included? | A brand count alone does not show the weight or stability of the sample |
| Market and period | Which countries, currencies, dates, seasons, and auction conditions apply? | Media cost and demand change across place and time |
| Business cohort | Which categories, price points, margins, customer types, and brand stages are grouped? | Economics and buying behavior may not be comparable |
| Campaign job | Are prospecting, retargeting, catalog, lead, sales, traffic, and awareness results separated? | Different objectives produce different metric patterns |
| Metric definition | Which click, conversion, revenue, and attribution definitions are used? | Identical labels can represent different calculations |
| Distribution | Are median, quartiles, range, and sample size shown—not only a mean? | The distribution reveals variation hidden by one central value |
| Data quality | Are refunds, cancellations, duplicates, tax, shipping, discounts, and missing tracking addressed? | Reported revenue may not match retained economic value |
Define the Metrics Before Comparing Them
| Metric | Calculation | Diagnostic use | Limitation |
|---|---|---|---|
| CPM | Spend divided by impressions, multiplied by 1,000 | Auction and delivery cost | Does not establish audience quality or profitability |
| Link CTR | Link clicks divided by impressions | Response to the ad and offer in its placement | Can rise with curiosity or weak traffic quality |
| Landing-page view rate | Landing-page views divided by link clicks | Click-to-page continuity and loading | Depends on event quality and consent |
| Site conversion rate | Defined purchases divided by defined sessions or visitors | Post-click effectiveness | Varies by denominator, intent, device, price, and product mix |
| CPA or CAC | Applicable spend divided by attributed orders or new customers | Acquisition affordability | Requires clear cost scope and customer definition |
| Platform ROAS | Platform-attributed revenue divided by platform spend | Directional platform reporting | Subject to attribution and deduplication limits |
| MER | Total revenue divided by defined marketing spend | Blended marketing efficiency | Includes demand not caused by current advertising and ignores margin |
| Contribution after acquisition | Net revenue minus variable product, fulfilment, payment, return, and acquisition costs | Nearer to sustainable unit economics | Still does not capture every fixed cost or cash-flow constraint |
Build the Right Comparison Cohort
Segment before comparing. Useful dimensions can include country, currency, product category, price band, margin band, new versus returning customer, prospecting versus retargeting, catalog versus non-catalog, device, placement, promotion state, season, inventory position, and attribution window.
Use a cohort only when it remains large enough to interpret. Excessive segmentation creates unstable numbers, while excessive aggregation hides the reason performance differs.
Mean, Median, and Distribution
The mean uses every value and can be influenced by very large or small observations. The median identifies the middle observation and is less sensitive to extremes. Neither is “the real benchmark” in isolation.
Review the sample size, median, relevant percentiles, range, and weighting method. An account-weighted result gives a small and large advertiser equal influence; a spend-weighted or impression-weighted result gives larger accounts more influence. The correct method depends on the question.
Internal Benchmark Ladder
- Measurement baseline: reconcile platform events with analytics, commerce orders, refunds, and collected revenue.
- Historical baseline: compare equivalent periods and annotate promotions, launches, tracking changes, and inventory events.
- Controlled cohort: compare like-for-like campaigns, products, audiences, markets, and objectives.
- Business target: calculate the acquisition ceiling and contribution requirement from current economics.
- External context: use transparent third-party distributions to generate questions, not automatic targets.
From Benchmark Gap to Diagnosis
| Observed pattern | Possible explanations to test | Next evidence |
|---|---|---|
| CPM rises while downstream rates stay stable | Auction, season, geography, placement, or audience mix changed | Delivery breakdown and contribution after acquisition |
| CTR falls within comparable delivery | Creative relevance, offer, frequency, placement, or measurement changed | Concept-level trend and qualified downstream behavior |
| Clicks remain stable but page views fall | Loading, redirects, consent, event quality, or accidental clicks | Site diagnostics and click-to-view reconciliation |
| Page views stay stable but purchase rate falls | Price, stock, product mix, page, checkout, shipping, trust, or demand changed | Funnel steps, errors, merchandising, and cohort behavior |
| Platform ROAS rises but contribution falls | Returning-customer mix, discounting, returns, low-margin products, or attribution changed | New-customer and reconciled margin view |
Set Targets From Unit Economics
Begin with net revenue and gross or contribution margin by product and customer cohort. Account for discounts, product cost, fulfilment, shipping subsidies, payment fees, returns, cancellations, acquisition spend, and any variable service cost. Include repeat purchase only when observed cohort retention supports it.
A higher CPM, lower CTR, or higher CPA can still be acceptable if the campaign produces stronger new-customer contribution or strategically valuable customers. A strong platform ROAS can still be unaffordable when attribution overstates incremental revenue or the product mix has weak margin.
Benchmark Reporting Template
- Decision and accountable owner
- Reporting period, market, currency, and campaign job
- Cohort inclusion and exclusion rules
- Metric definitions, denominators, and attribution windows
- Sample sizes and data-completeness limitations
- Current result, comparable internal baseline, and target derived from economics
- External source and methodology where used
- Confirmed finding, likely explanation, remaining hypothesis, and next test
- Guardrails for margin, cash flow, inventory, returns, and customer experience
Use Benchmarks to Ask Better Questions
Benchmarks are diagnostic context, not universal standards. A useful comparison helps identify where to investigate while the business's own acquisition ceiling, contribution, capacity, and customer outcomes determine whether performance is acceptable.
Use the Meta Ads account audit framework to connect benchmark gaps with measurement, structure, creative, landing pages, and economics. Powerhouse Media's performance marketing services can support implementation and reconciled reporting.
Related Insights
Continue exploring Paid Ads
Ready to apply this to your brand?
We partner with brands looking to scale profitably.
Apply for a strategy call